- By Axel Timmermann
Allow me to take you on a little walk down memory lane. 2023 was, from a climate scientist’s perspective, an extremely unusual and surprising year: it will be remembered by the world as the hottest one since instrumental recordings began in the 1850s (Figure 1); it saw the development of a major El Niño that wreaked havoc across our planet and contributed to an unprecedented yearly temperature increase; it ended with a historical UN COP-28 meeting in Dubai where government representatives, NGOs and thousands of people from various industries and interest groups met to finally announce “the beginning of the end” of the fossil fuel era [UN Climate Change Press Release, 13 December 2023]. Here in South Korea, 2023 will be remembered as a year with unusually high autumn temperatures, even triggering a cherry blossom in Yeosu in November (6 months ahead of schedule) and, unfortunately, a year when Busan lost the climate-solution-oriented world EXPO bid to the petrostate Saudi Arabia. But let us take a deeper dive into some of the issues at hand.
A. The unprecedented warming of 2023
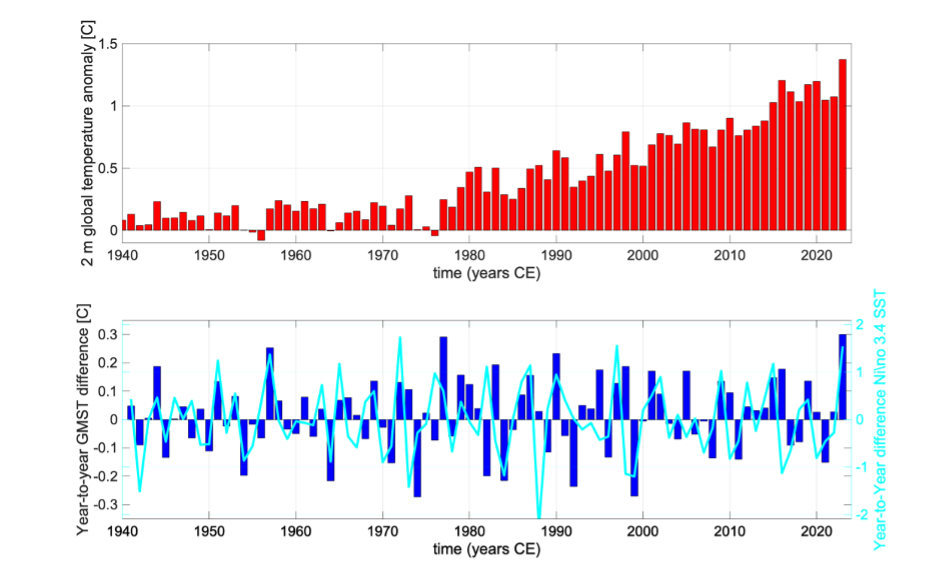
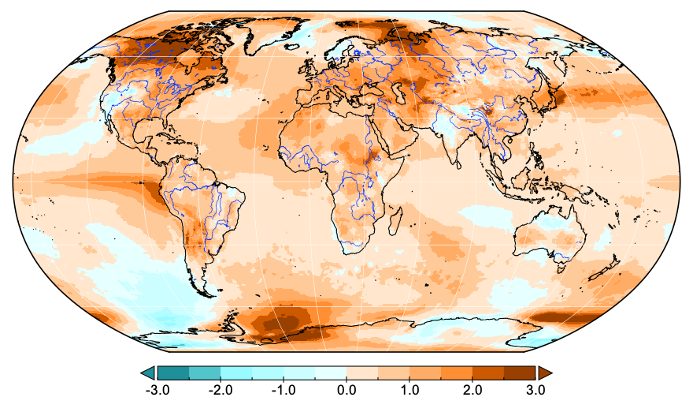
The raw annual mean global temperature record since the 1940s speaks volumes (Figure 1, upper panel). Over the last decades we have seen an acceleration of global mean temperature anomalies, but the year 2023 really stands out as an extreme with global mean values reaching close to 1.4oC above the 1850-1879 reference period. Superimposed on this mostly anthropogenic warming trend, which emerges as the net temperature response to increasing greenhouse gases (warming) and changing aerosol concentrations (cooling) are also year-to-year fluctuations (Figure 1, lower panel), which can be attributed to a combination of temperature anomalies generated by the El Niño-Southern Oscillation (ENSO) and other factors such as volcanic eruptions (e.g., El Chichon in 1982 or Pinatubo in 1991) or small changes in solar irradiance etc. In 2023 the strongest annual warming occurred over the eastern equatorial Pacific, parts of the Southern Ocean near Antarctica, where sea-ice declined rapidly for the first time in decades, northern Canada, the Barents Sea and the northwestern Pacific, east of Japan (Figure 2).
According to the recent temperature observations, the rapid temperature jump in 2023 was unprecedented during at least the past 60 years, with yearly warming rates reaching 0.3oC (Figure 1, lower panel). A similarly rapid warming occurred also between 1976 to 1977, attaining a value of 0.29oC back then. Given the unusual situation in 2023, it is important to identify the underlying physical mechanisms for the unexpected record yearly warming.
Climate scientists have realized already around early summer of 2023 that the rate of global warming increased beyond everyone’s expectations. What factors could explain the rapid annual warming? Four candidates have been proposed: A) the Hunga Tonga-Hunga Ha’apai volcanic eruption in January 2022, which blew about 125-150 million tons of water into the stratosphere, where it can potentially serve as a potent greenhouse gas and warm our planet for a few years (1, 2); B) In 2020 the International Maritime Organization decided to reduce sulfur-bearing shipping fuels to improve public health near ports. Many shipping companies have already implemented these new guidelines, which caused a reduction in global SO2 emissions in 2023 and a corresponding increase of sunlight reaching the earth’s surface. C) atmospheric changes in the subtropical eastern Atlantic (Figure 2), which may have also contributed to the rapid annual warming tendency. D) the transition from the triple-dip La Niña event 2020-2022 to an El Niño (Spanish for “the little boy”) event in 2023. Let’s review here the evidence for or against these hypotheses.
Regarding the Hunga Tonga-Hunga Ha’apai eruption, using ICCP’s supercomputer Aleph, Dr. Lan Dai from our center, in collaboration with Dr. Tido Semmler from Met Éireann injected 125 million tons of stratospheric water vapor into a state-of-the-art earth system model to simulate the climate response to the massive volcanic explosion. The results after several weeks computation time were clear: the observed anomalous 2023 warming is too large to be explained by the Hunga Tonga-Hunga Ha’apai eruption (personal communication). This finding is also consistent with a recent study that only finds a minor projected warming of less than 0.05oC by 2023 in response to the stratospheric water vapor radiative forcing from the eruption (3).
On to hypothesis B) then: The warming effect from reduction in SO2 emissions from shipping fuels should be mostly visible along the main shipping global lines. This does not seem to be the case (Figure 2). Moreover, due to the thermal inertia of the oceans, the effect from reducing shipping emissions would build up gradually over the next 10 years, reaching a value of 0.032oC by 2030 (4). By 2023 the effect would only be ~0.02oC, which is far too small to explain the excess warming of 0.3oC observed in 2023 (Figure 1, lower panel).
Some thoughts on hypothesis C): Monthly global mean temperatures already broke records in late spring to summer of 2023. An area that really stood out then was the subtropical northeastern Atlantic (Figure 2), where regionally-averaged temperatures temporarily exceeded 1.3oC above normal conditions, reaching values locally of even up to 3-4oC in May and June. This warming can be linked to a particularly weak Azores High pressure system and corresponding weak trade winds. Weaker trade winds contribute to regional warming in four different ways: i) less upwelling of cold water in the Canary current system; ii) less evaporative cooling because of weaker wind speeds; iii) fewer low-level stratus clouds; iv) less transport of sun-light-absorbing Saharan dust over the ocean. All these factor contributed to the rapid development of category 4 (extreme) marine heatwaves in the northeastern tropical Atlantic, which also impacted global mean temperature values during this time. But given the relatively small area of the subtropical Atlantic compared to the global surface area, it is very unlikely that the Atlantic trade-wind weakening was the main culprit for the 0.30C annual warming tendency.
B. 2023 El Niño – the unruly child
As my fingers type these lines in a cozy coffee shop in Busan, 12,000 km farther southeast a climate anomaly lurks of almost epic proportions – the 2023/24 El Niño event, an unusual warming of the equatorial Pacific (Figure 3), which according to satellite data and ocean observations has become one of the strongest events of the last 100 years. It started to develop in early 2023, with anomalies in the far eastern equatorial Pacific peaking in August at 3.5oC above average and subsequent accelerated warming occurring over the central Pacific intensifying until December 2023 to reach about 1.5-2oC (Figure 3). This climate phenomenon has caused wide-spread climate anomalies around the globe in 2023, such as in Central America, Australia, and California. Anticipated rainfall deficits are expected to exacerbate food insecurity in the coming months in South Africa, Botswana and Zambia, with likely impacts on millions of people in this region.
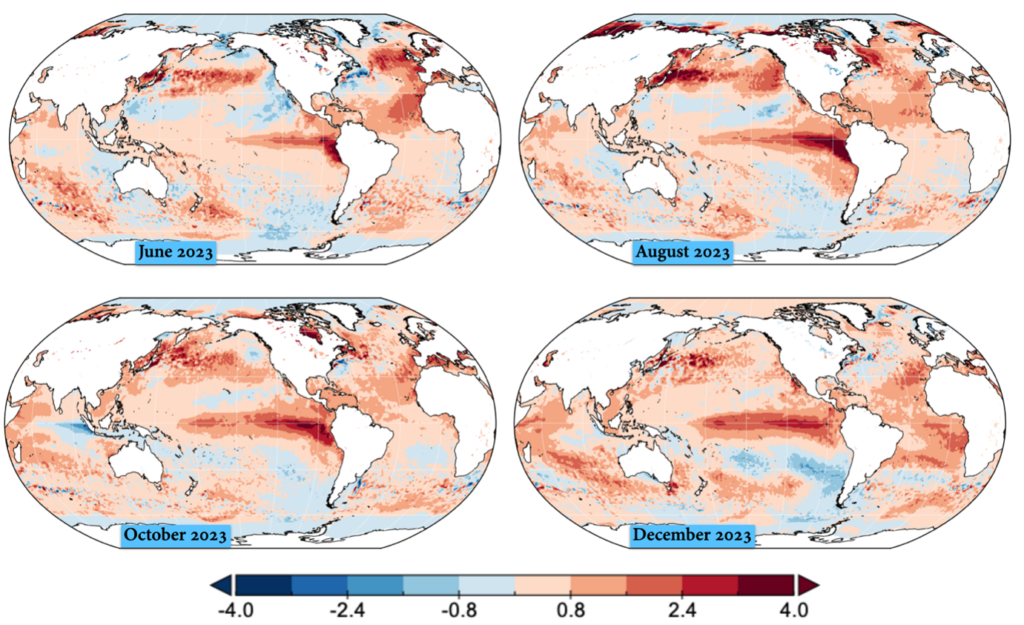
It has been well documented that strong El Niño events, which are characterized by a large-scale warming of the central and eastern equatorial Pacific (Figure 2,3) can increase global mean temperatures temporarily by as much as a 0.2 oC (or 0.07 oC +/- 0.2oC per degree El Niño warming in the central equatorial Pacific) – in particular in the 2-4 months following the peak El Niño in January (5). Clustering of La Niña events, such as the 2020-2022 triple dip situation, on the other hand can create longer term natural cooling, which can significantly damp global mean temperatures (6), such as during the Global Warming hiatus period between 1998-2012 (Figure 1).
In general, the central Pacific warming during an El Niño increases evaporation causing an oceanic cooling tendency. Furthermore, during El Niño there are more clouds, which reduce solar radiation, thereby intensifying the oceanic cooling. On the other hand, as more clouds form, more water vapor condenses in the atmosphere, which warms up the air. Thus, El Niño events release “excess” heat from the ocean to the atmosphere, which impacts the planetary energy balance. For La Niña it is the opposite.
In the absence of any major volcanic eruptions or other factors, we would expect the global mean temperature to fluctuate from year-to-year a little bit due to the activity of the ENSO phenomenon and other types of natural climate variability. This is clearly illustrated in Figure 1, lower panel, which shows the year-to-year changes in global mean surface temperature and in the central Pacific. Both timeseries have a correlation of 0.4 (significant at p<0.05). Clearly not every El Niño leads to global warming and not every yearly global temperature anomaly can be linked to El Niño (e.g., 1977). Nevertheless, we can see that the unusual global warming in 2023 aligns well with a rapid warming from the 2022 La Niña to the 2023 El Niño state. However, assuming a scaling of 0.07oC global warming per oC in the central Pacific would only explain 37% of the amplitude of the observed yearly global warming rate in 2023 (Figure 1, lower panel).
According to this simplified statistical argument, other processes such as those discussed for the earlier hypotheses need to still be invoked. However, there is still another possibility…
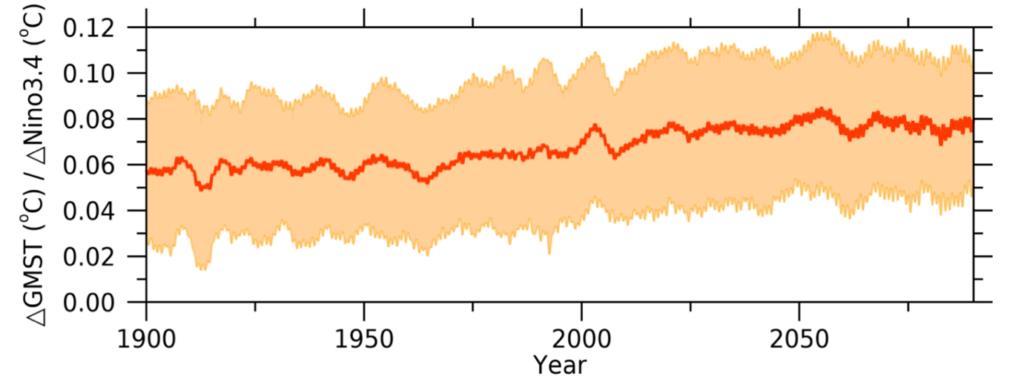
It is possible that the scaling factor of 0.07oC between El Niño and the global mean temperature is not as stable as previously assumed, but that it changes in response to the available atmospheric moisture, which itself is impacted by year-to-year internal climate variability and the longterm greenhouse warming trend. According to a climate model simulation that we recently conducted on the ICCP/IBS Aleph supercomputer (7), the average scaling factor between yearly fluctuation in global mean temperature and ENSO used to be 0.06oC during pre-industrial times, now it amounts to 0.07oC. In response to future global warming and following an SSP3-7.0 greenhouse gas emission scenario, the scaling factor increases by about 30% to about 0.08 oC towards the century due to the increased availability of atmospheric moisture in a warmer world (Figure 4). This can be understood by the fact that more water vapor becomes available in a warmer planet due to Clausius Clapeyron equation (8) which can also lead to more tropospheric warming during an El Niño event. Furthermore, by using 100 climate model simulations, we can also estimate the possible fluctuations in the value of the scaling parameter, that originate from just the internal climate noise, without human impacts. This is indicated by the orange shading in Figure 4. We can see that around 2023, this value can naturally go up as high as 0.11, which for the given 2023 El Niño situation, would result in a warming anomaly of 0.17oC (about 60% of the observed value).
It is fair to say, that climate scientists to date do not have a complete explanation yet for the unprecedented yearly warming in 2023. Therefore, more research needs to be conducted to better understand the causes of rapid year-to-year global temperatures tendencies and their relationship to internal climate instabilities versus external forcings. Following the simple analysis presented above, we can summarize that 40-60% of the 0.3ooC yearly warming in 2023 can be explained by ENSO, whereas the remainder (60-40%) needs to be attributed to a mixture of other factors, such as natural weakening of trade winds over the northeastern tropical Atlantic, which triggered a warming chain reaction in this region. What still remains unclear is what caused the unusual and large-scale warming over the Northern extratropical Pacific, east of Japan (Figure 2). Even though the pattern resembles the typical El Niño teleconnection pattern, the associated amplitude is too strong to be explained only by tropical factors only.
There is still more research to do before we fully understand the 2023 global climate anomaly or other unusual events such as in 1977 (Figure 1, lower panel).
C. 2024 Outlook
What to expect for 2024? According to the latest climate prediction models the current El Niño is expected to fade out towards April-May 2024 and likely reverse into a La Niña, which is known to deliver detrimental climate impacts in some parts of the world, including the Horn of Africa (drought), Australia (e.g., Great Barrier coral bleaching) and the Southwestern US (drought). According to Figure 1, lower panel, the La Niña transition will likely weaken the global warming rate temporarily, as compared to 2023. Nevertheless, with increasing greenhouse gas concentrations, the year 2023 will soon be exceeded by other even warmer years. Therefore, 2023, might be seen as a warning sign, a harbinger, of what to expect on average over the next 5-8 years.
Let’s move back to the societal stage: The COP28 meeting in Dubai finished in 2023 with several important declarations on climate and health, reduction of methane emissions, the establishment of climate loss and damage funds and a pledge (referred to as the UAE consensus) of the participants to accelerate efforts “towards the phase-down of unabated coal power” and measures that “drive the transition away from fossil fuels in energy systems, in a just, orderly and equitable manner, with developed countries continuing to take the lead” [UN Climate Change Press Release, 13 December 2023]. Some groups applauded this agreement as an important milestone, but many climate activists are concerned that the words “orderly and equitable manner” imply that the main fossil fuel companies want to sit in the driver’s seat of this process and maximize their profits from fossil fuel extraction for as long as possible, thereby delaying urgently needed action. A way for governments to counter this concern would be to finally divest from coal and fossil fuels, stop further construction of fossil fuel power plants and introduce appropriate carbon taxes that would accelerate the phase-out from these planetary warming agents.
Here in South Korea we are seeing somewhat conflicting developments; on the one hand the carbon neutrality committee of the government is sincerely trying to develop a roadmap towards carbon neutrality, whereas KEPCO, Doosan Heavy Industries & Construction Company, backed by South Korean public financial institutes, such as K-Sure and KEXIM, are in the process of building a large coal power plant for Indonesia in Suralaya, Java[1]. Even though the use of cleaner fuel options for this plant, such as dual-fuel ammonia, has been discussed[2], it is still likely that the Suralaya plant will be mostly used to burn off a part of Indonesia’s large coal reserves. This situation raises the question, whether public financial institutions in South Korea or elsewhere which provide loans for international construction projects, should also take a closer look at the overall carbon footprint of the considered projects, and make decisions based on the general internationally accepted framework of carbon neutrality and not only economic profit.
The term “Greenwashing” has been introduced recently to describe the apparent gap between cushy words, green slogans and real climate action. In fact, we see plenty of evidences of Greenwashing in our daily lives, when e.g., hotels ask you on nicely printed recycled paper card to save energy by re-using your towels, whilst hotel rooms and sometimes even outside corridors are still heated up in wintertime to 25C, which amounts to carbon emissions orders of magnitude larger than washing towels.
But the good news is that public awareness towards the climate crisis has increased tremendously (Seoul’s climate public transport card being a good example). However, the implementation of green policies, renewable energy technologies, such as those recognized by RE100, is still way too slow – both in South Korean and globally. As the general concern about the climate crisis increases in the public, it is time now to empower the young generation, who will suffer most from the consequences of global warming, and finally allow them to shape their own future. In future they must be engaged in key decision making processes on provincial to national levels.
- M. R. Schoeberl et al., The Estimated Climate Impact of the Hunga Tonga-Hunga Ha’apai Eruption Plume. Geophysical Research Letters 50, (2023).
- P. Sellitto et al., The unexpected radiative impact of the Hunga Tonga eruption of 15th January 2022. Communications Earth & Environment 3, (2022).
- S. Jenkins, C. Smith, M. Allen, R. Grainger, Tonga eruption increases chance of temporary surface temperature anomaly above 1.5 °C. Nature Climate Change 13, 127-+ (2023).
- J. Fuglestvedt et al., Shipping Emissions: From Cooling to Warming of Climate-and Reducing Impacts on Health. Environmental Science & Technology 43, 9057-9062 (2009).
- K. E. Trenberth, J. M. Caron, D. P. Stepaniak, S. Worley, Evolution of El Nino-Southern Oscillation and global atmospheric surface temperatures. Journal of Geophysical Research-Atmospheres 107, (2002).
- M. H. England et al., Recent intensification of wind-driven circulation in the Pacific and the ongoing warming hiatus. Nature Climate Change 4, 222-227 (2014).
- K. B. Rodgers et al., Ubiquity of human-induced changes in climate variability. Earth System Dynamics 12, 1393-1411 (2021).
- K.-S. Yun et al., Increasing ENSO-rainfall variability due to changes in future tropical temperature-rainfall relationship. Communications Earth & Environment2, 10.1038/s43247-43021-00108-43248 (2021).
[1] https://www.reuters.com/article/idUSKCN24H0QT/ https://www.eco-business.com/news/south-korea-faces-public-scrutiny-for-financing-coal-plants-in-indonesia/
[2] https://www.kedglobal.com/energy/newsView/ked202309080010